Accessible Reports at Ramboll
A client needed its reports to meet a city accessibility regulation. I learned to tag them by hand, set consistent rules for complex data tables, and wrote a guide my team now uses.
- Role
- Accessibility tagging, standards and documentation
- Scale
- More than 100 report tables tagged
- Standards
- PDF/UA and WCAG
- Tools
- Adobe Acrobat Pro, PAC (PDF Accessibility Checker)
- Status
- Ongoing
The Problem
A client needed its reports to meet a city accessibility regulation. The reports run 100+ pages and are full of data tables, and a screen reader can’t make sense of a table that isn’t tagged. Without tags, a table is read as one long run of numbers, and the listener can’t tell which row or column a value belongs to. Every file has to pass the PDF/UA check in PAC with zero errors before it goes into the report package.
My part: I learned to tag reports by hand in Acrobat, set the tagging rules for our tables, and wrote the guide my team uses.
From Problem to Decisions
| What I saw | What it meant | What I decided |
|---|---|---|
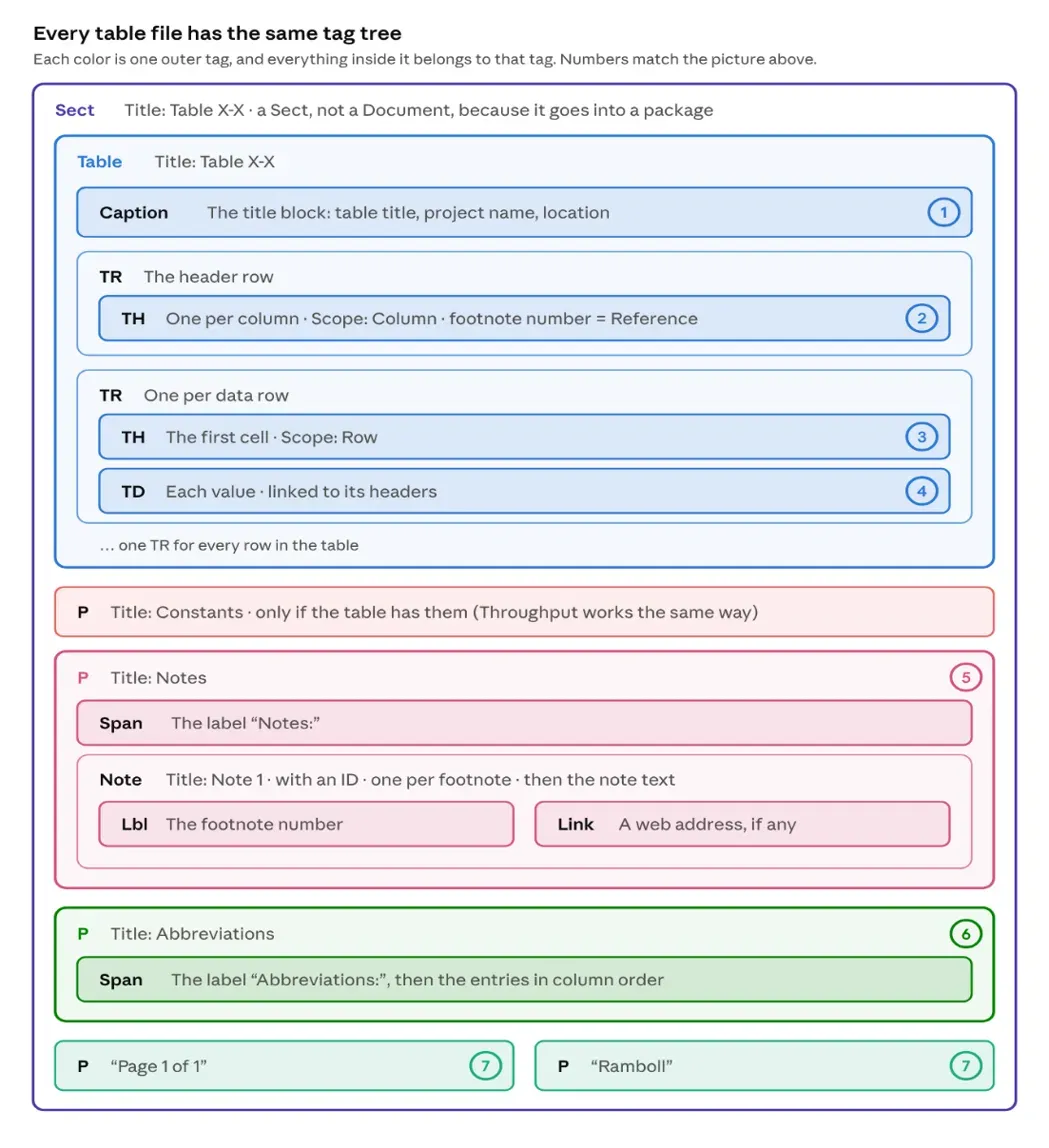
| Every table is its own PDF, and the tables are combined into one report package. Design Decision | Each table has to drop in as one section of the report, built the same way every time. | Tag each table under a Sect instead of a Document, with one shared structure for every table. |
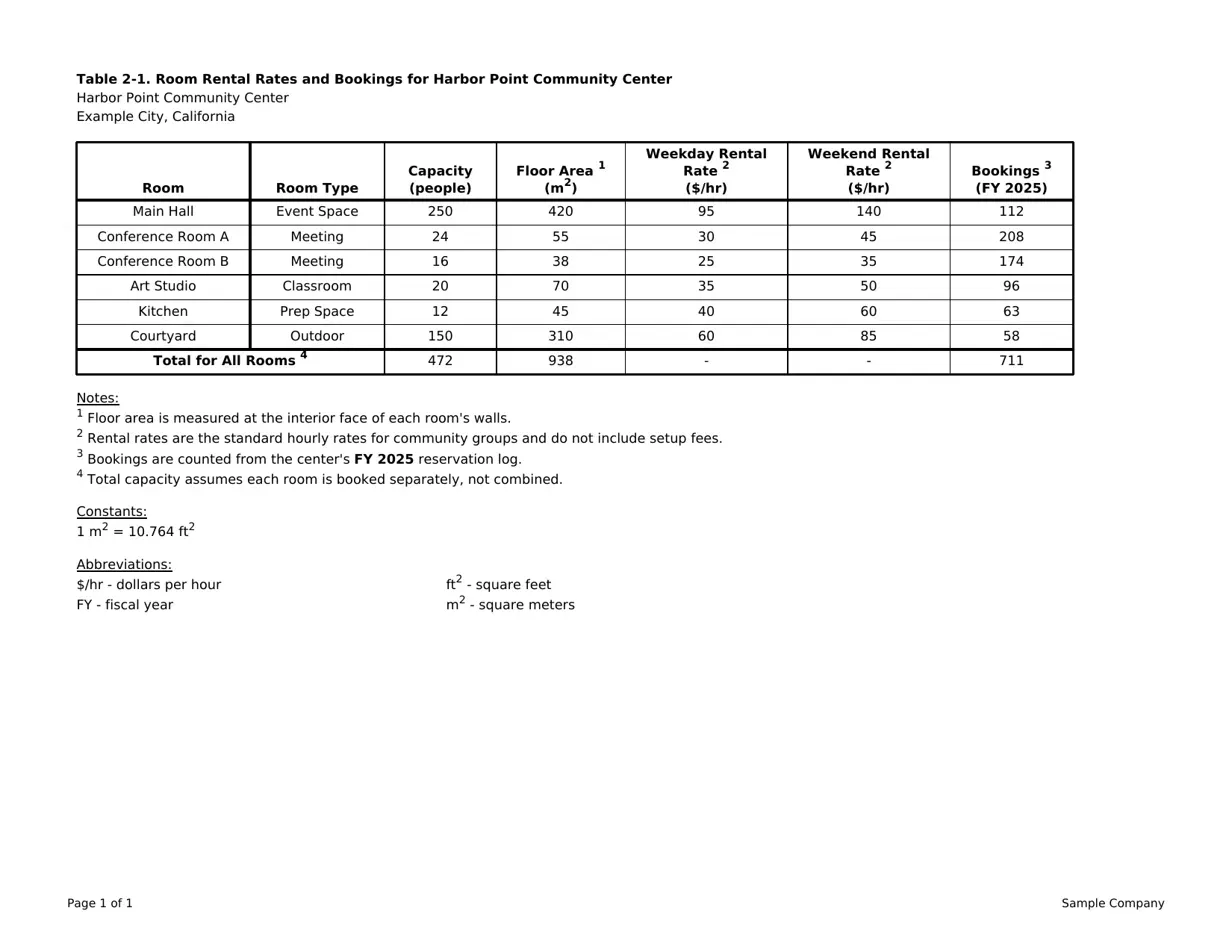
| Each table has a title, project and location block above it. Design Decision | Screen reader users need that context before the data. | Tag the header block as the table's caption, so it's announced when a listener enters the table. |
| Untagged, a table is read as one long run of numbers. Design Decision | Listeners need to hear which row and column every value belongs to. | Header cells with a scope, so each value is read with its row and column names. |
| Notes, constants and abbreviations sit under the table but aren't data. Design Decision | Tagged as rows, they'd be read as part of the table. | Tag them as separate paragraphs, with each note labeled and tied to its footnote marker. |
| Subscripts and superscripts were read in pieces, and header words that wrap onto two lines ran together. Design Decision | A screen reader could read a unit like m² as separate fragments, or two words as one. | Actual Text on those terms, so each reads as one unit with spaces where they belong. |
| I was the only one who knew how to tag reports. Design Decision | The work would stall whenever I was out. | A step-by-step guide, with a troubleshooting table, that my team now uses. |
How I Tag a Table
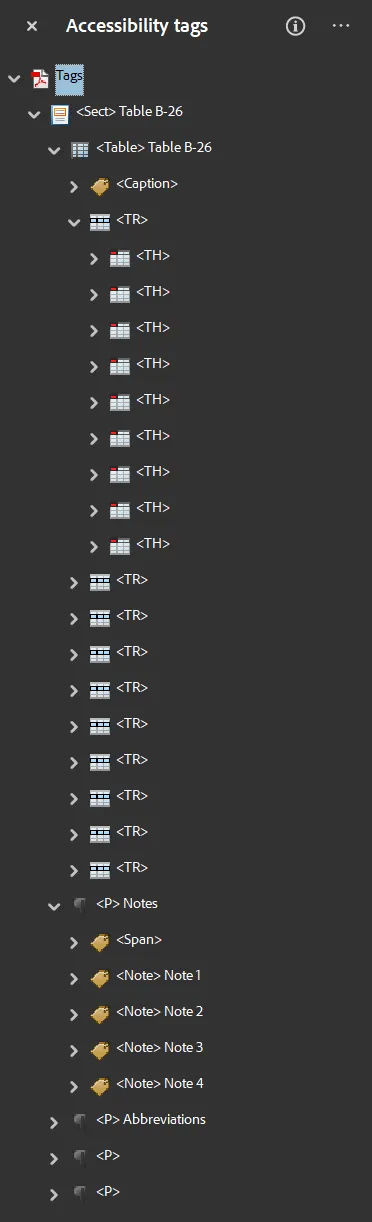
The client work is confidential, so these images show a sample table I made with fictional data, the tag structure every table follows, and my Acrobat Tags panel from a real table, with only the table number showing.